Building Charts
Nitro Explorer is preloaded with several datasets you can use to begin creating charts. You can also create your own dataset. See Creating Datasets for more information.
To create a chart:
-
Select the +Chart button in the Charts section of the Nitro Explorer home page.
-
Select a dataset to use.
-
Select a visualization type.
-
Select Create New Chart.
-
Select Save to name the chart and save it.
Once created, you can change the chart visualization type, the dataset used, and other chart characteristics as you explore the data.
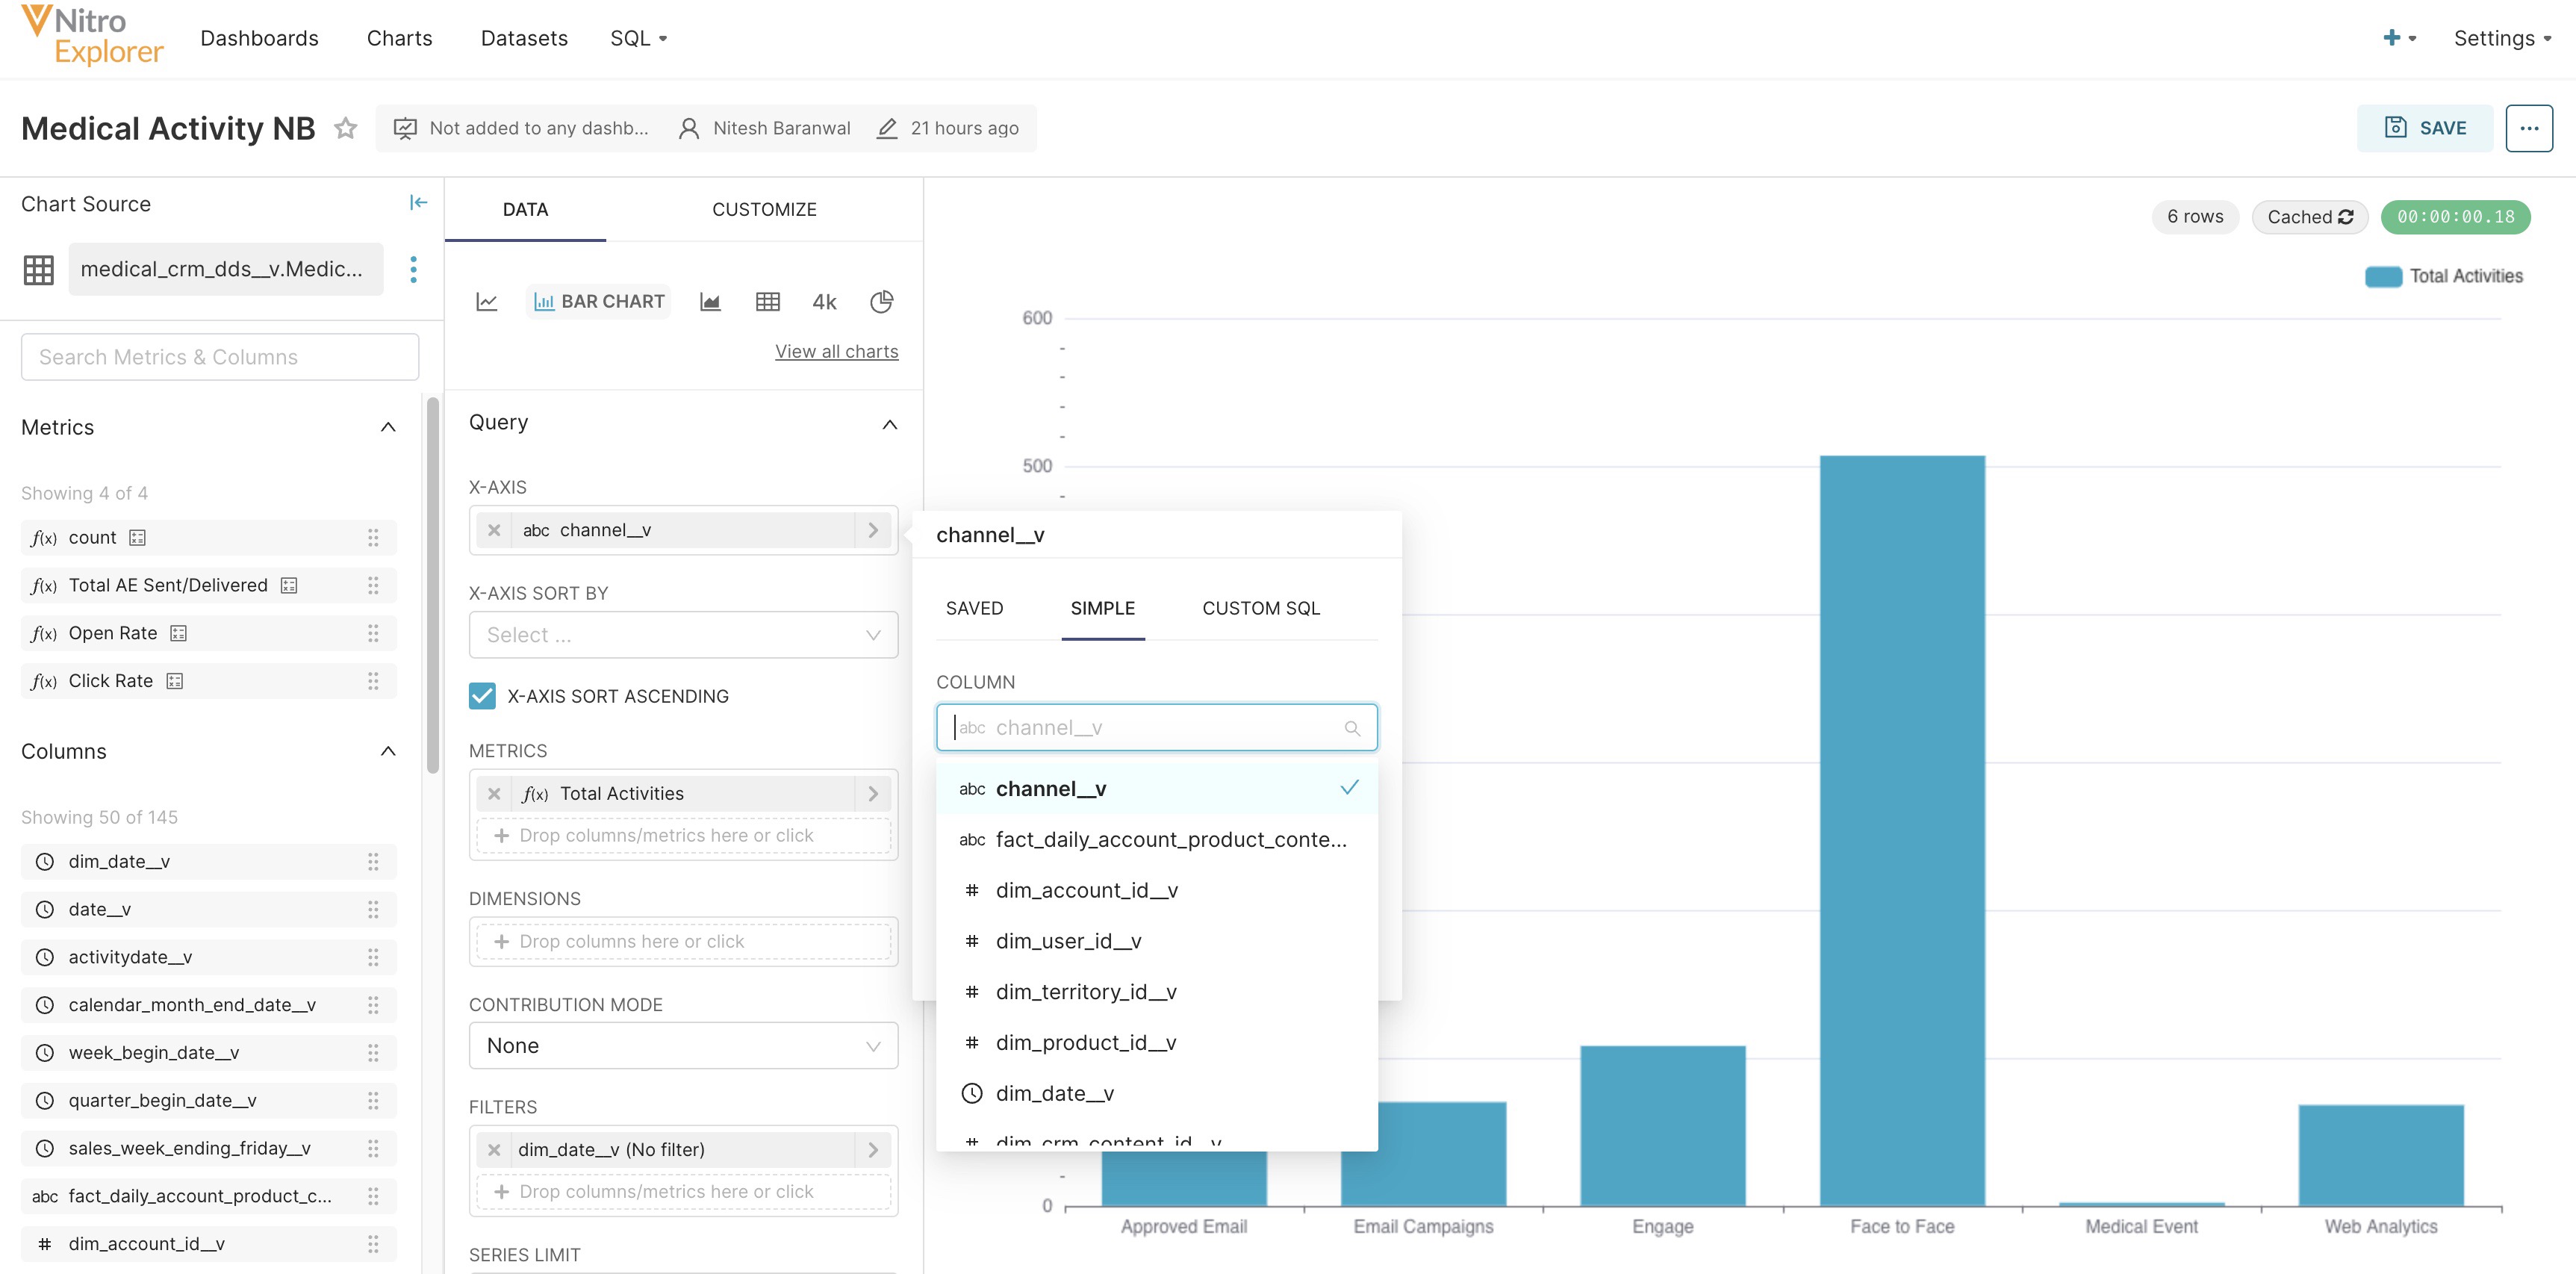
A categorical chart x-axis is available that allows users to create chart types that do not require a time based x-axis, for example, brand or country.
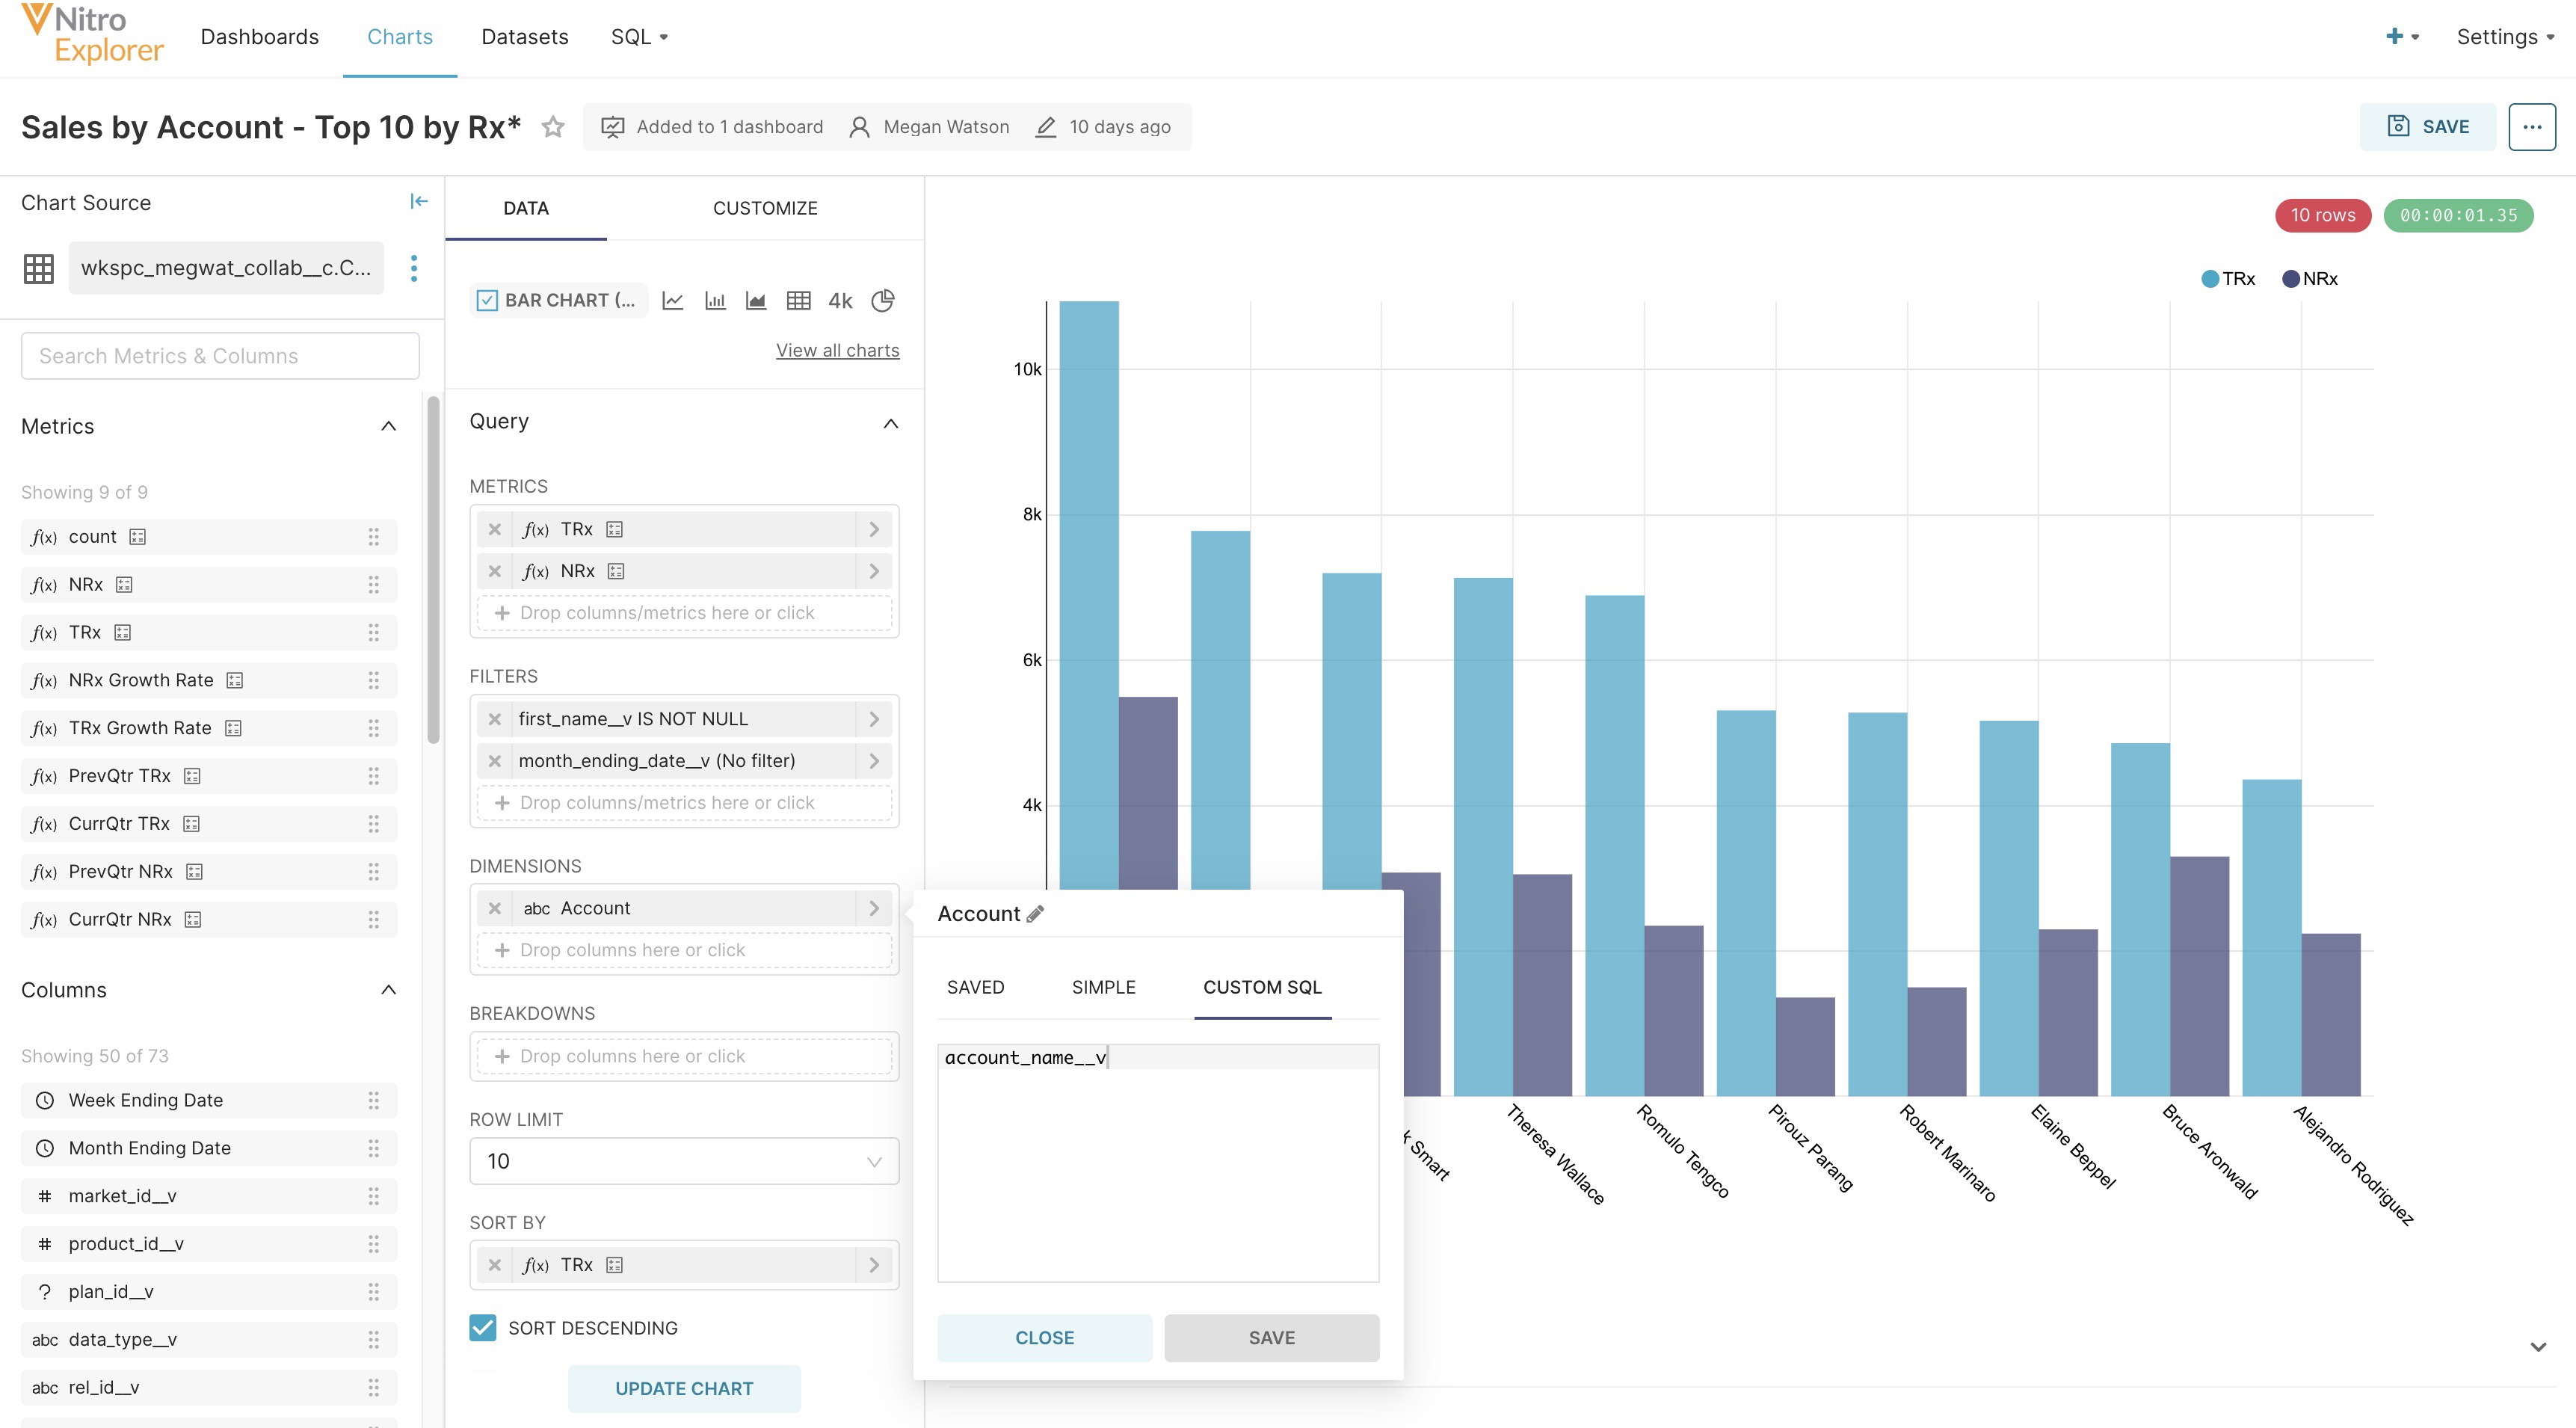
Adding Custom SQL
To increase efficiency when building custom charts, users can write custom SQL expressions directly in charts without adding them to the dataset as saved expressions. A new Custom SQL tab is available when editing columns.