Creating Dashboards
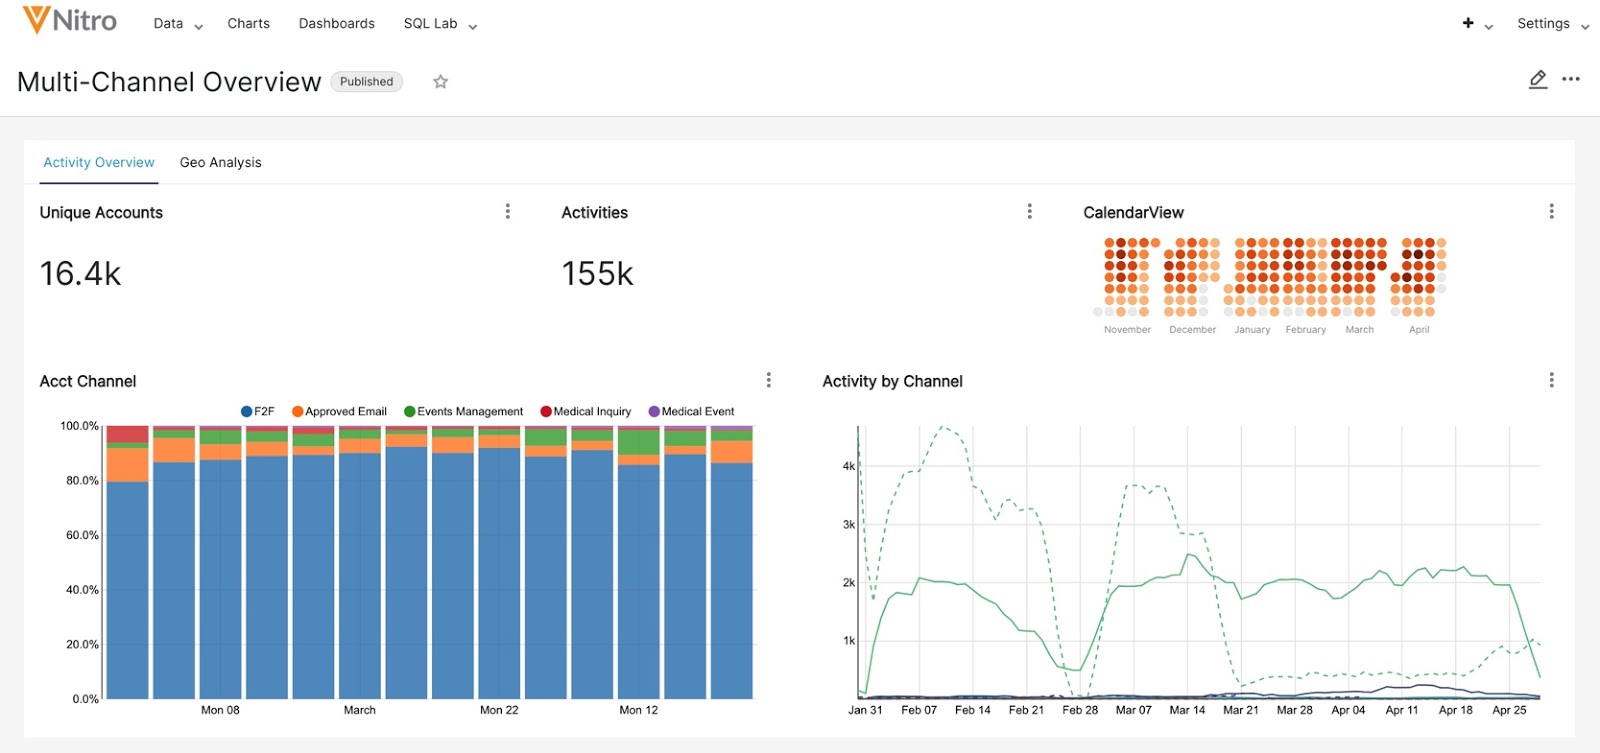
Users can create dashboards to provide a more complete picture of their data.
Prerequisites
- At least one chart has been created.
To create a dashboard:
-
Select +Dashboard from the Nitro Explorer home page.
-
Select the Components menu to customize the dashboard by adding tabs, rows, columns, headers, and dividers, or by inserting Markdown components. This step is optional.
-
Select the Charts menu to add a chart to the dashboard.
-
Select Save.
Filtering Dashboards
To improve efficiency, users in Nitro Explorer can create advanced filtering directly from the dashboard. This eliminates the need to create separate filters as charts.
To create a filter:
-
Open the dashboard you want to work with.
-
Select Add/Edit Filters from the Filters menu.
- Select the desired values.
- Select Save.
To filter displayed data:
-
Select the filter(s) for the data you want to display from the Filters menu.
-
Select Apply Filters.
Filters are applied to all charts on the dashboard. To reset all applied filters, select Clear All.
To view which filters are applied, select the filter icon on any chart.
Filter Dependencies for Native Filters
Targeted results can be achieved by creating filters that restrict the values in a filter based on the selected values of other filters in the same dashboard.
Dashboard Cross-Filtering
Users can apply a data element from a chart (for example, a table row) by selecting the chart to apply it as a filter across all other eligible charts in the dashboard. Eligible charts include:
- ECharts
- Time Series Chart
- Pivot Table Chart
- Table Chart
To enable Dashboard Cross-Filtering:
-
Select the More Actions button on an eligible chart.
-
Select View chart in Explore.
-
Select Emit Dashboard Cross Filters on the Explore page in the Filters section.