Using Charts
Users can filter the list of charts to display those used by the selected dashboards.

Displaying Chart Data
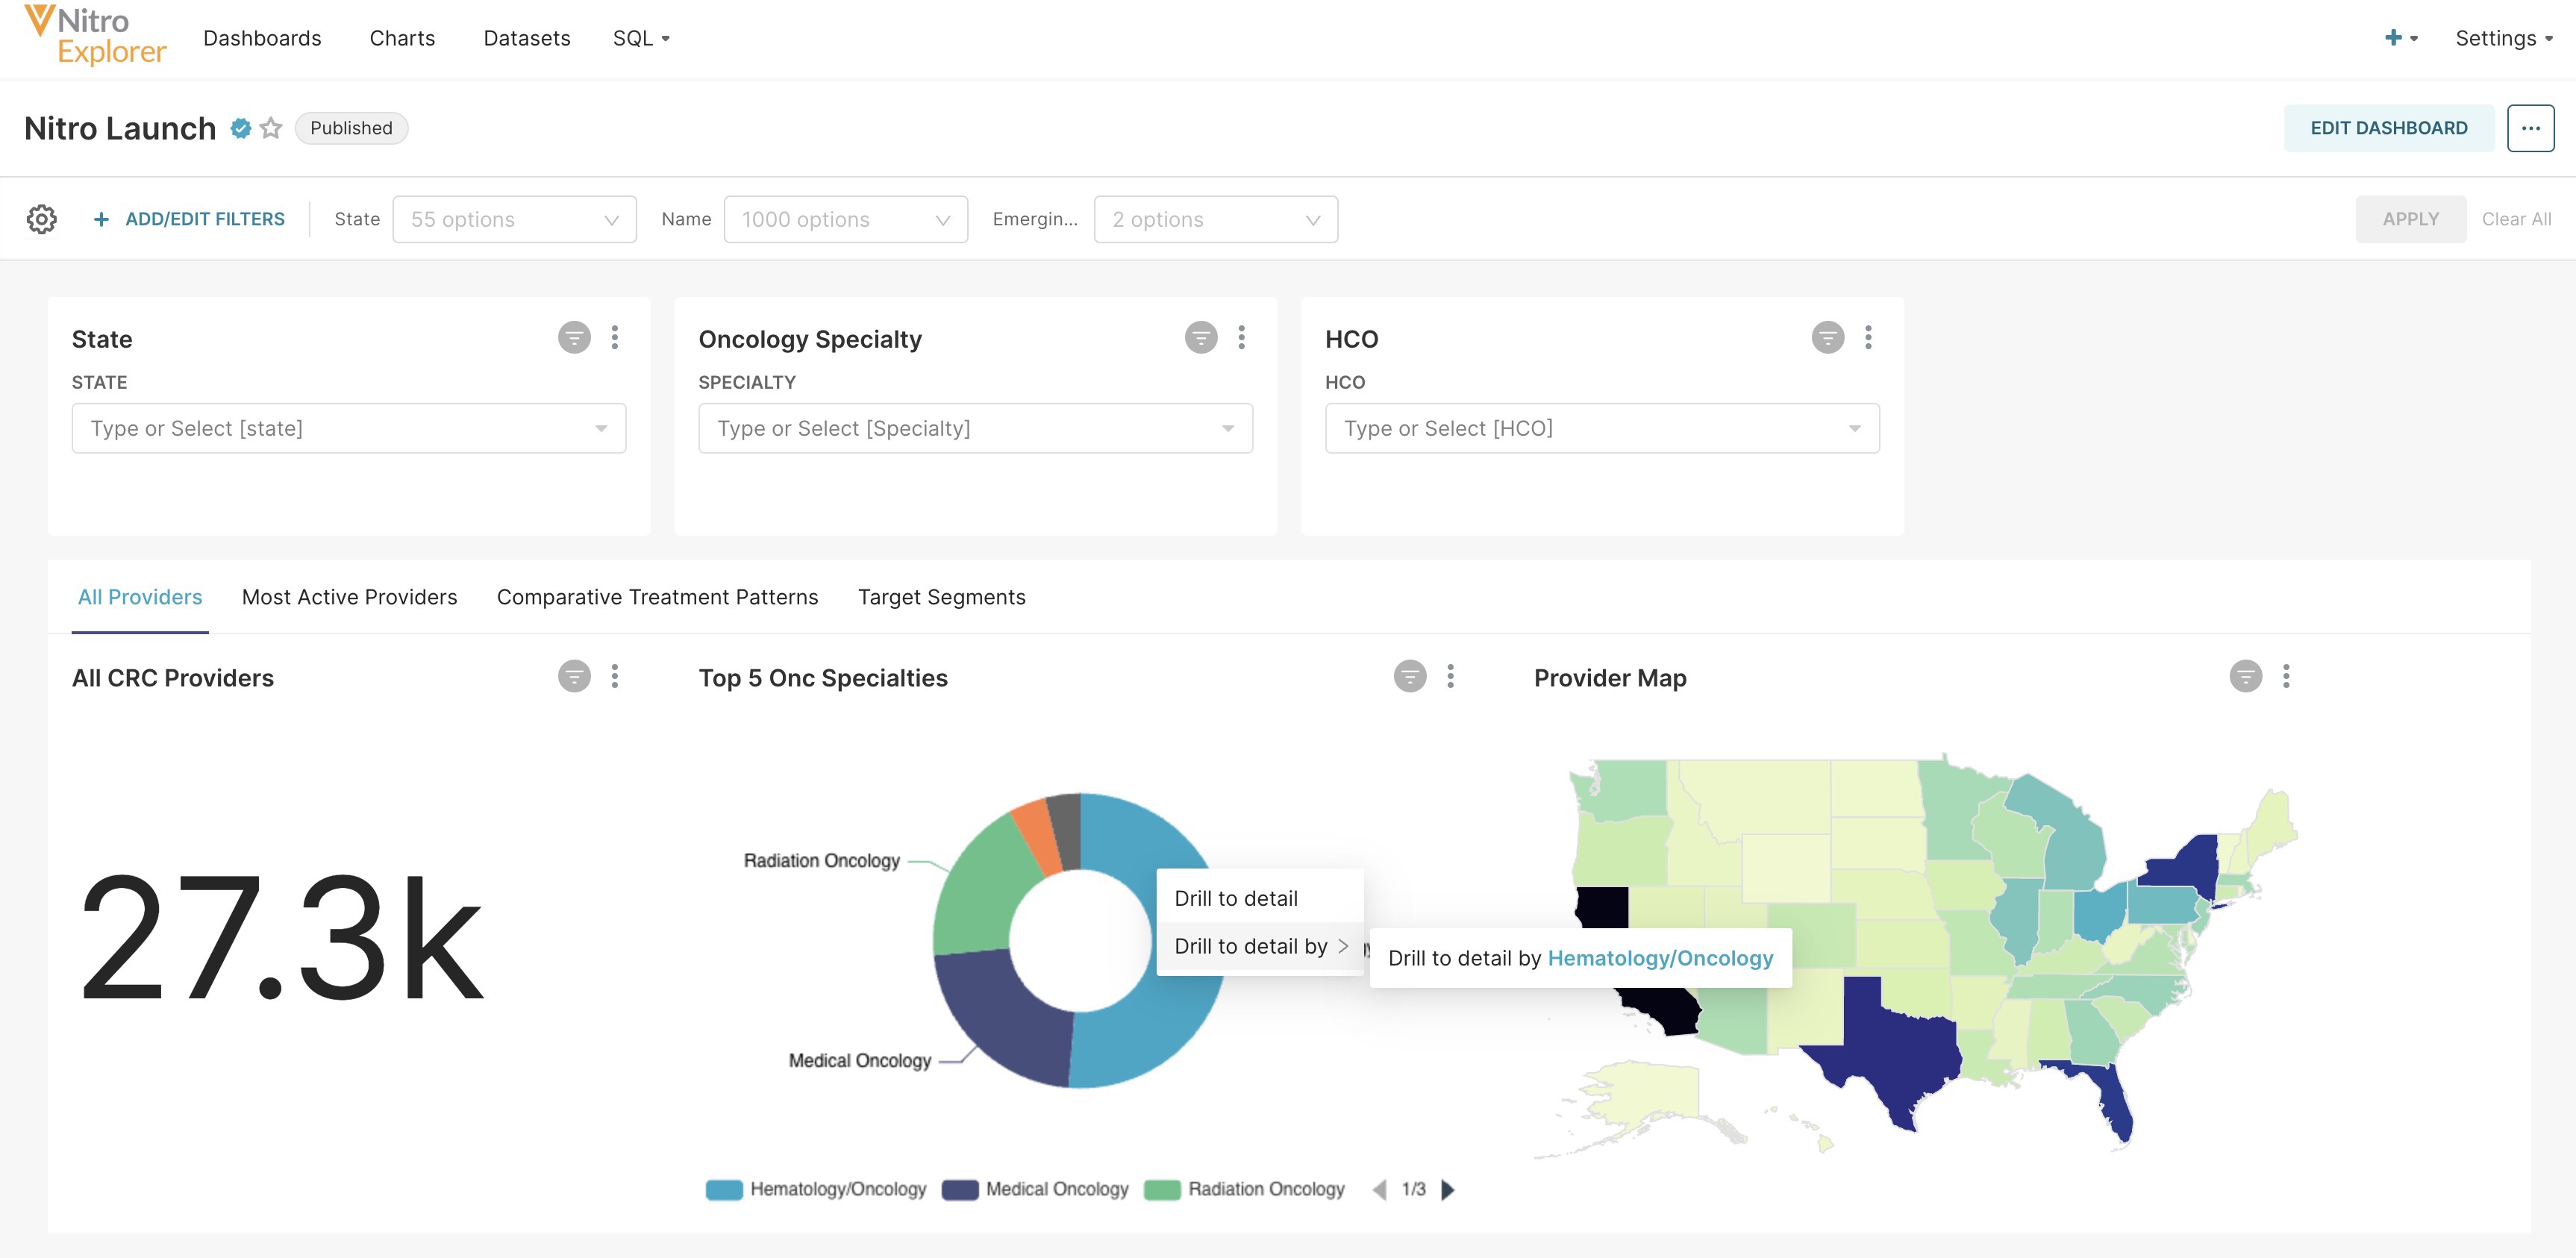
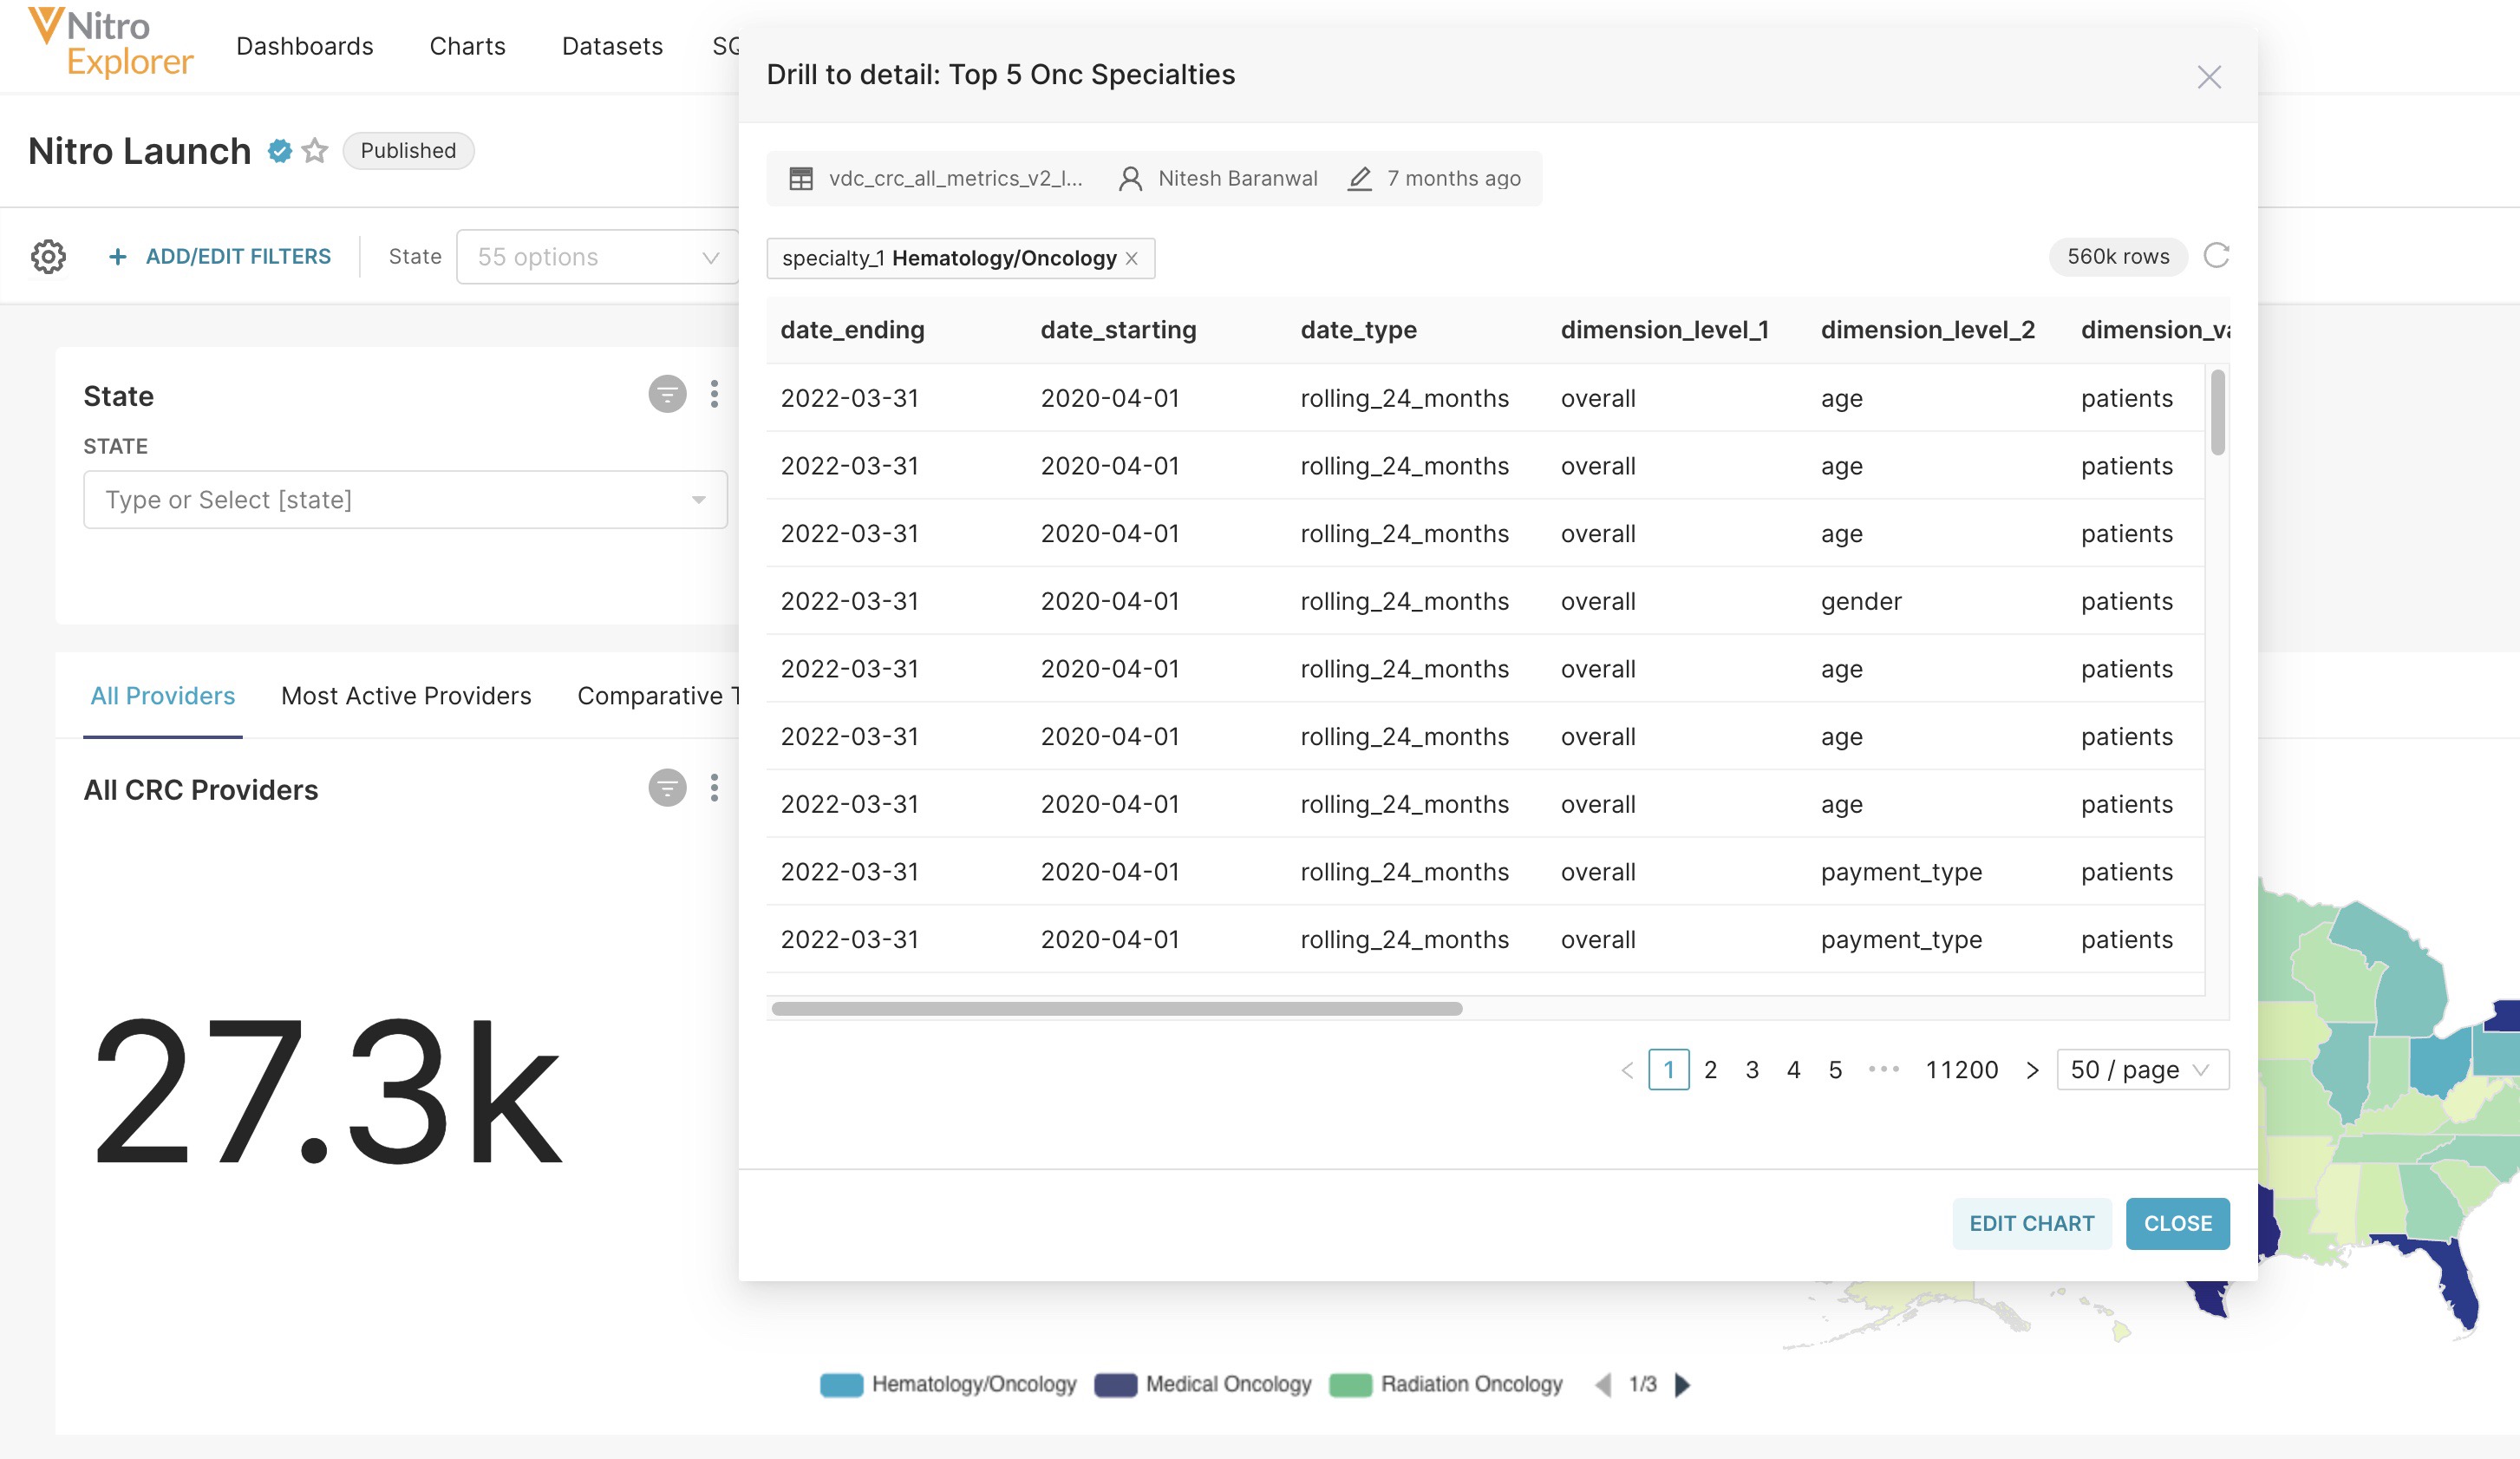
To display a table of a chart's underlying data, right-click on a chart type or right-click a specific part of certain charts. For example, select a wedge in a pie chart to display a table of the underlying data with a particular filter applied to the results. The resulting modal allows users to further understand and contextualize the granular data aggregated into the chart, including its dataset and owner(s).
To display underlying data for a chart:
-
Open a chart.
-
Right-click on a specific part of the chart for which you want to see details.

-
Select Drill to Detail.

Modifying Charts
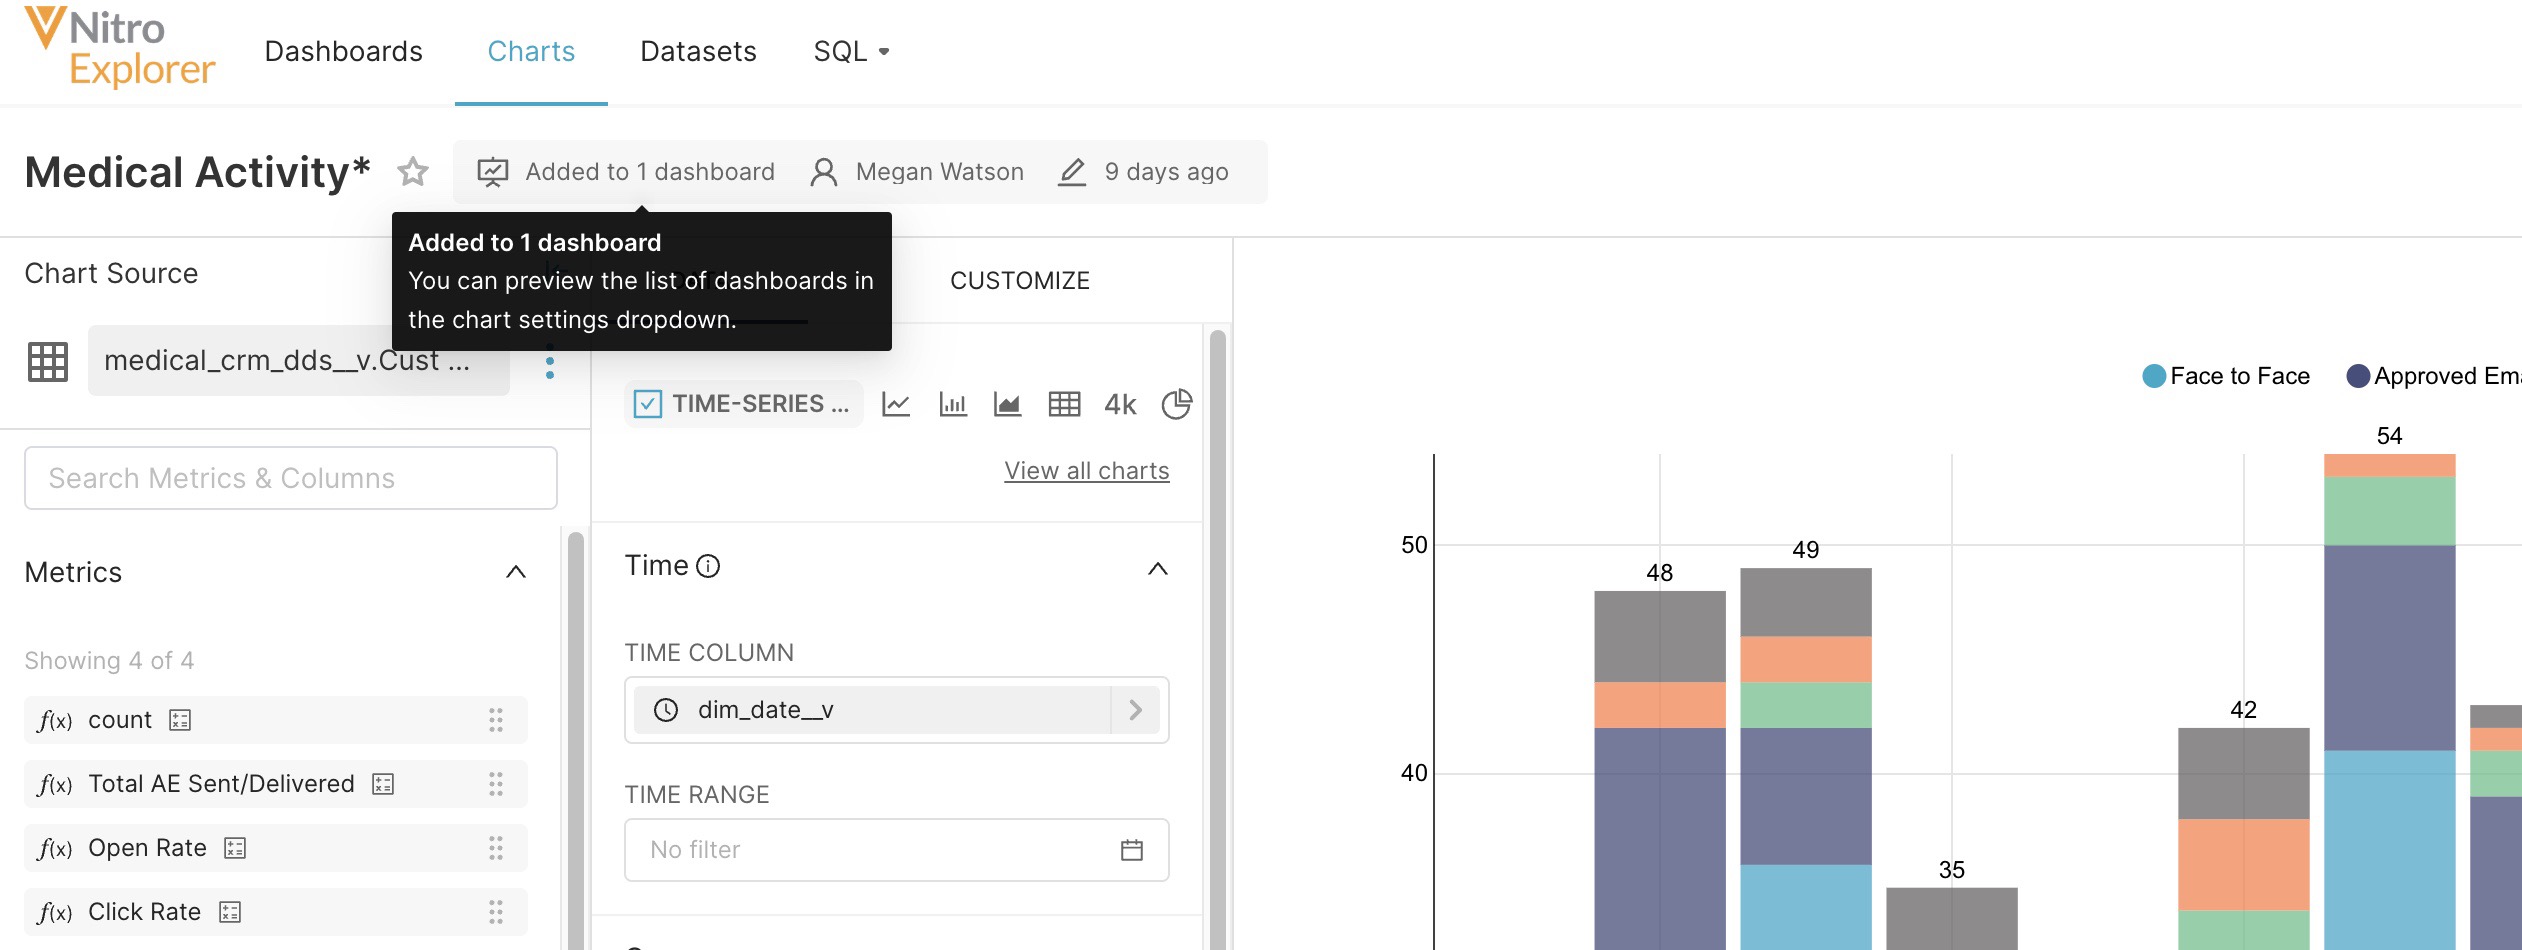
When modifying a chart, users can see how many dashboards are affected by the changes before saving.
Users can view the complete list of dashboards where the chart s used and select a dashboard to view it in the context of other, related data.

Exporting Chart Data
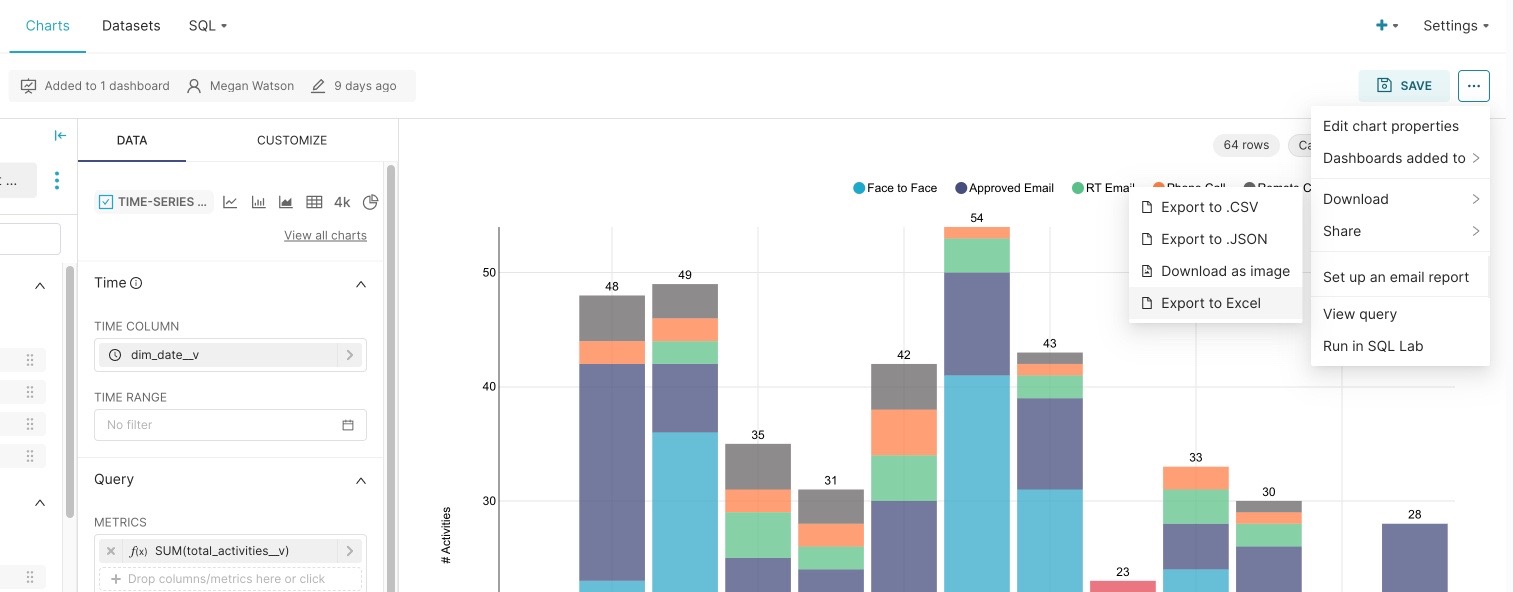
Users can export chart data in .CSV, .JSON. or XLSX format, or as an image.
To export chart data:
-
Select the Charts tab.
-
Select a chart to view.
-
Select the More Actions menu..
-
Select Export.
-
Select the export option you want to use. The file is downloaded.


