Usage Metrics
Query Volume Dashboard
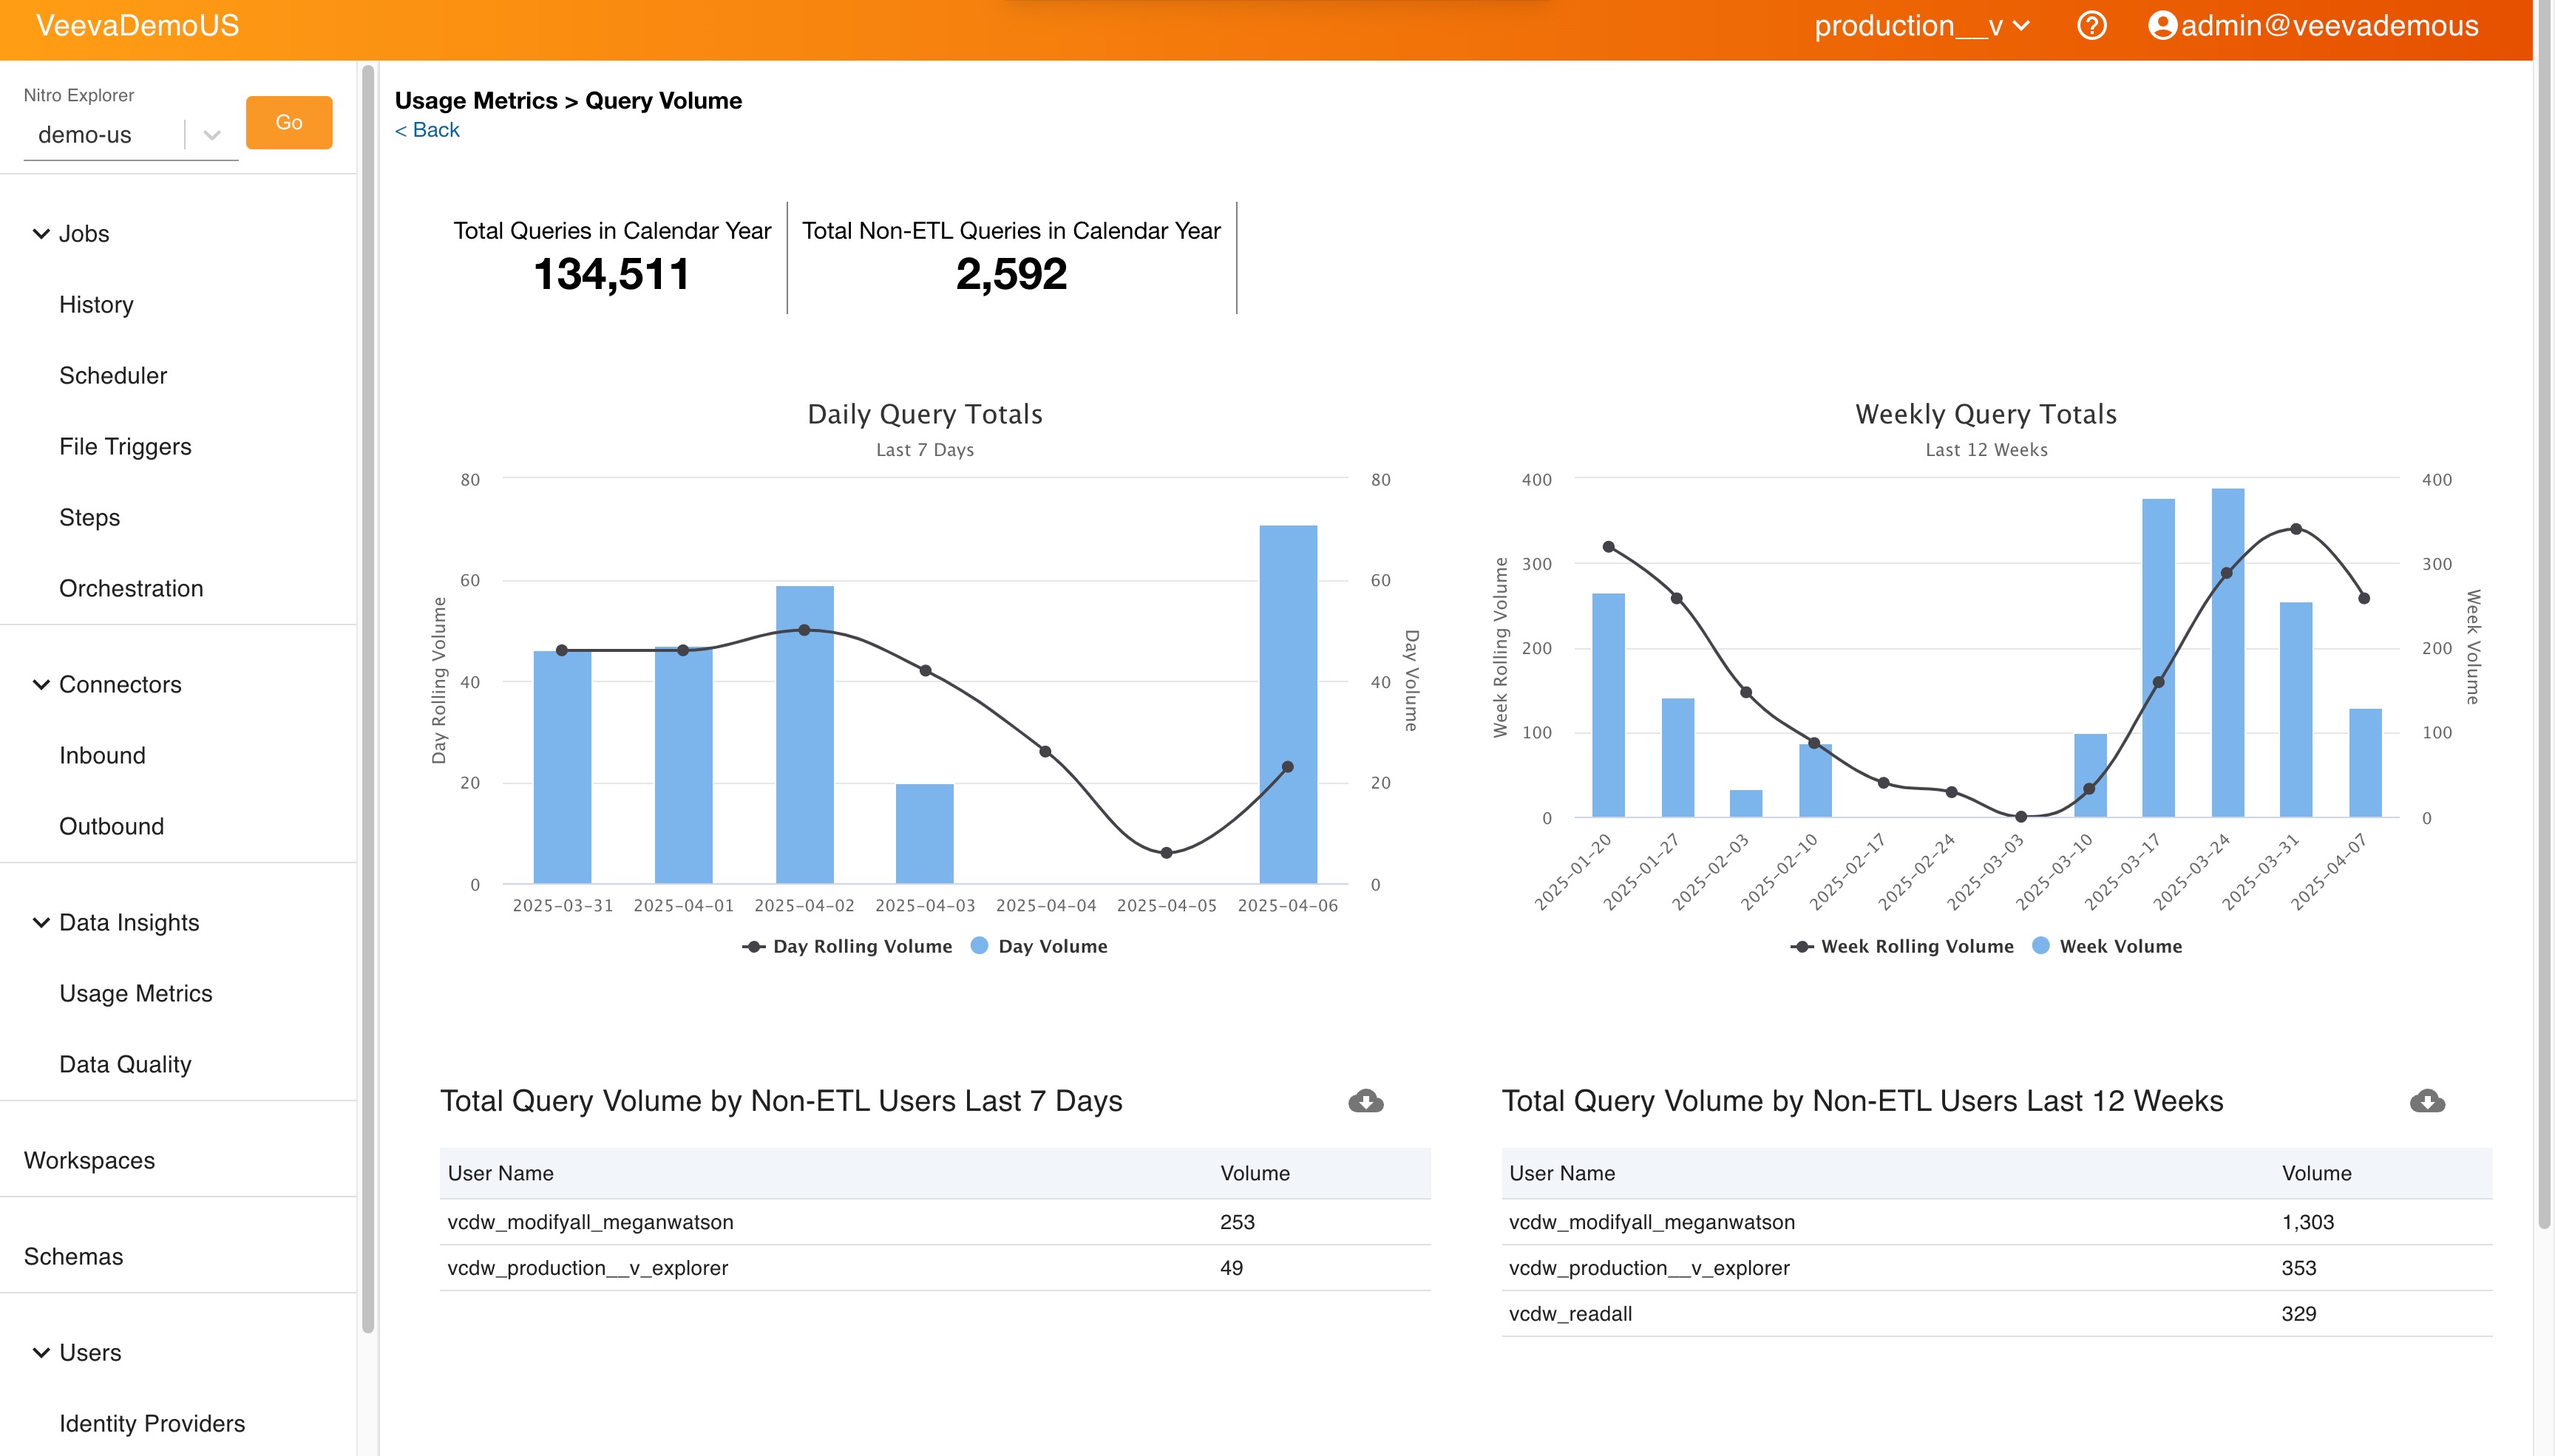
The Query Volume Usage Metrics visualizations help system administrators, data stakeholders, and analysts understand usage of data. Several queries are used to display the total number of queries run by users within each instance. Metrics are displayed according to the following queries:
- Query Volume, Daily Volume and Daily Rolling Volume Last 7 Days
- Query Volume, Weekly Volume and Weekly Rolling Volume Last 12 Weeks
- Top Users by Query Volume, Last 7 Days
- Top Users by Query Volume, Last 12 Weeks
- Total Queries in Calendar Year
- Total Non-ETL Queries in Calendar Year
Data volumes are displayed in MB.
To view the visualizations:
- Log into the NAC.
- Select Usage Metrics from the Data Insights section of the NAC menu.
ETL Job Logs
ETL Job Logs are available for Redshift/Explorer users to view the number of jobs completed successfully and recurring failure types. This information helps users better understand the health of their system. ETL job logs can also be examined for the quality of jobs over time and for details on FTP type jobs.
Persisted raw ETL job logs are posted in the etl_job_results_log__v table. Other operational metrics are stored in separate tables. ETL Job information provided includes:
- Jobs completed
- Jobs failed
- Jobs completed with warnings
To access ETL Job logs:
-
Submit a support ticket requesting access to the Metrics database for your username.
-
Use External Tools to view the ETL Job logs.
ETL Job Metrics Dashboard
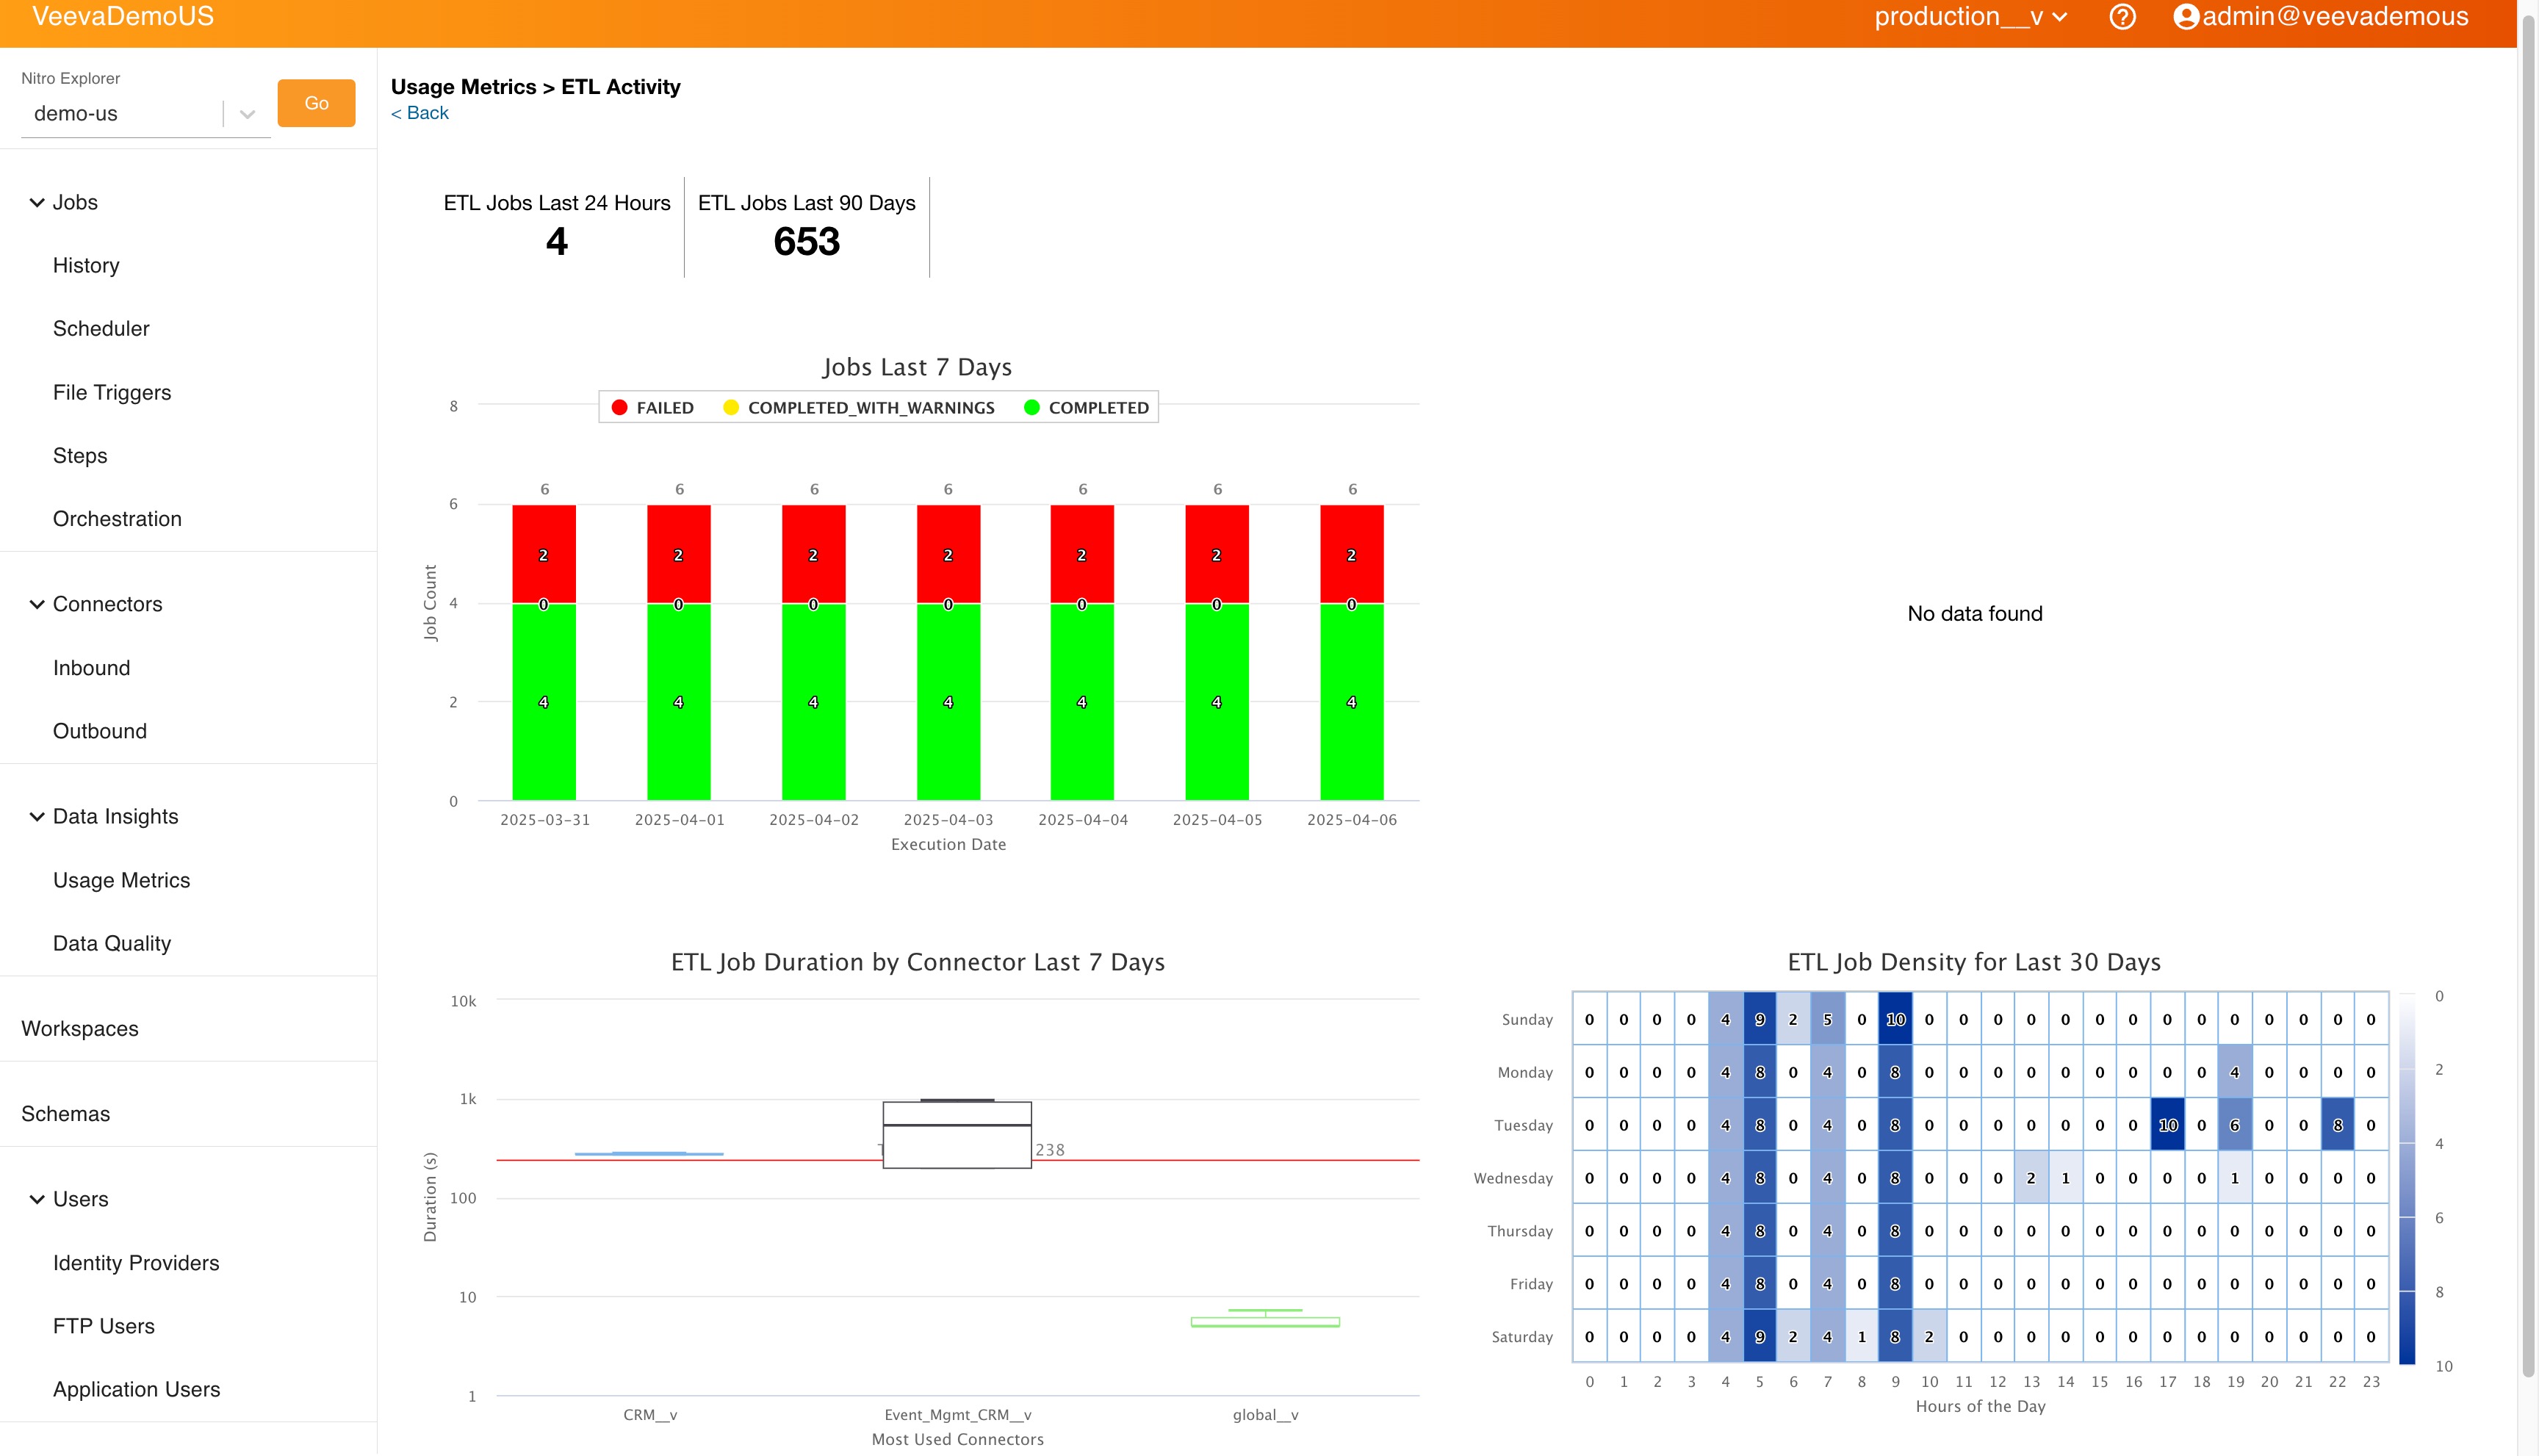
An ETL job metrics dashboard is available from the Usage Metrics menu in the Nitro Admin Console. This helps system admins to understand the health of the system by getting insights on the number of jobs that completed successfully and recurring failure types to allow for better visibility and troubleshooting.
The dashboard displays visualizations for the following ETL job statuses:
- Daily job status metrics over the last 7 days with an option to drill down on filtered raw job logs
- Daily job distribution by file-based connector over the last 7 days with an option to see connector level error distribution and filtered raw job logs
- Job runtime by connector
- Job count heat map by day of week and hour matrix
Space Utilization Dashboard
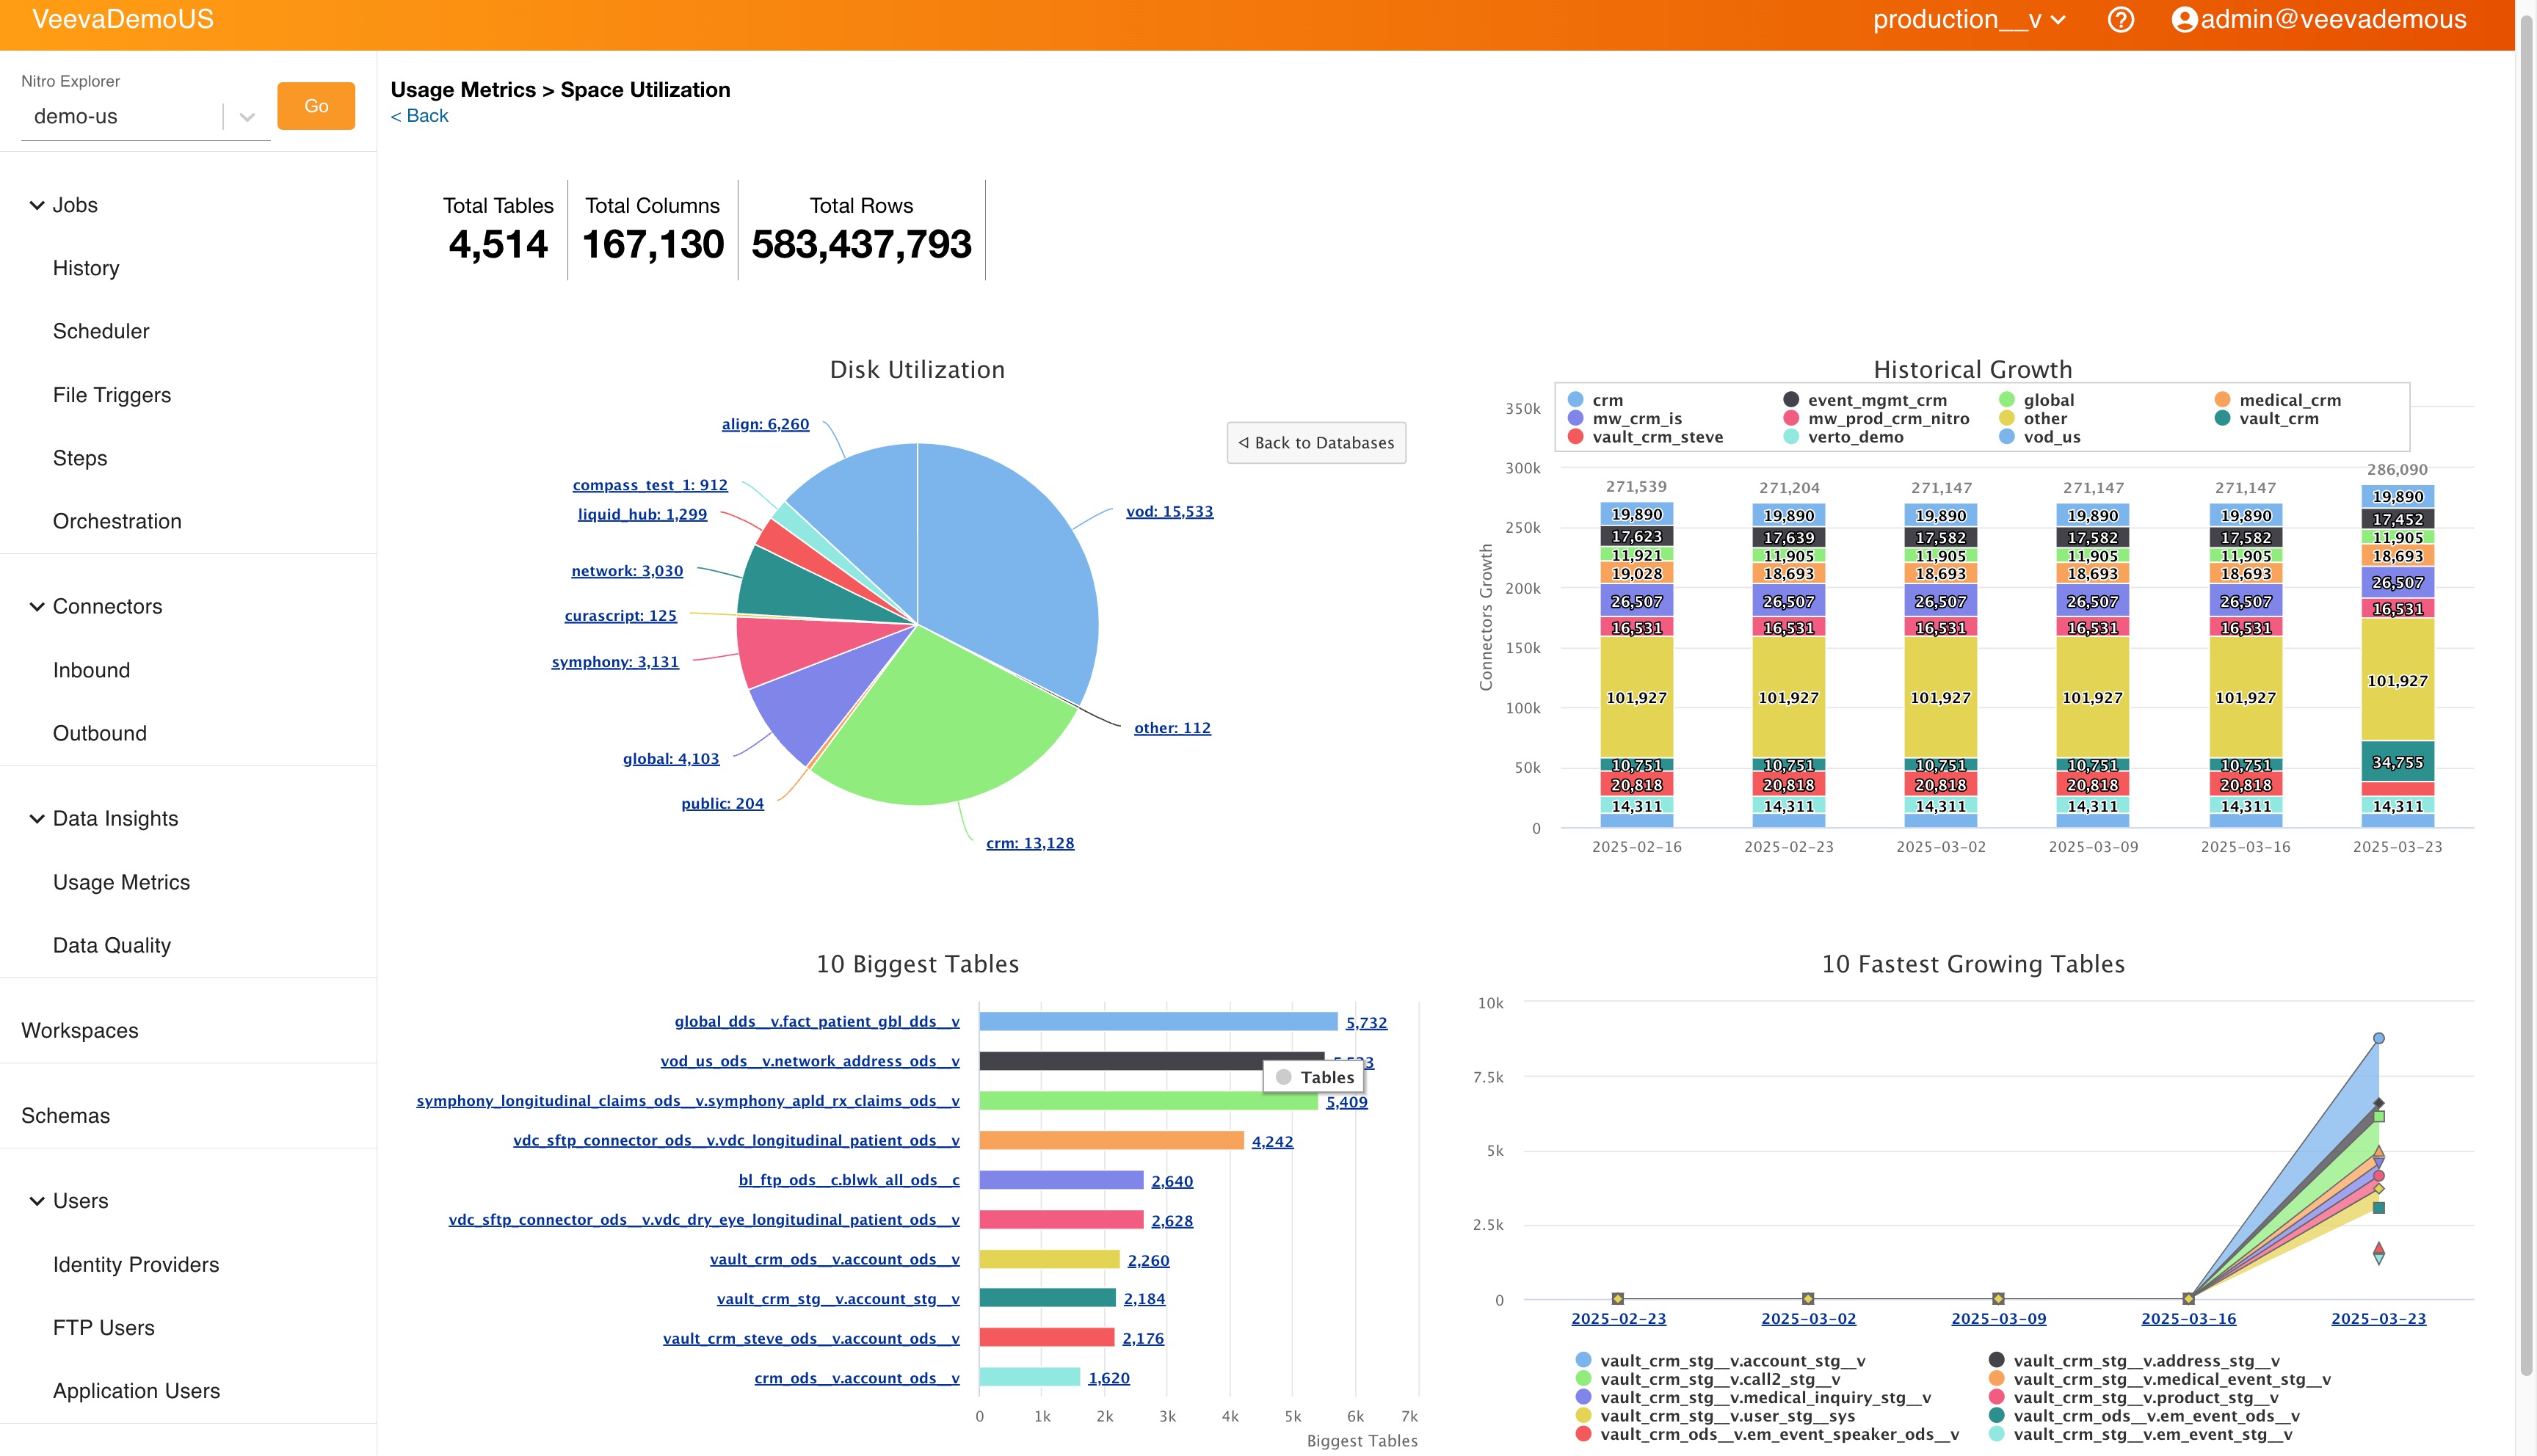
To determine which objects are consuming the most data in a Nitro cluster, admins can use the Space Utilization dashboard. Admins can also view their data utilization changes over time, how much data they have, where it's allocated, and which section is growing the fastest.
The Space Utilization dashboard includes the following:
- Total Tables (as of the most recent recorded date)
- Total Columns (as of the most recent recorded date)
- Total Rows (as of the most recent recorded date)
- Current Disk Allocation
- Historical Growth by Connector
- 10 Biggest Tables
- 10 Fastest Growing Tables
To view the visualization:
-
Log into the NAC.
-
Select Usage Metrics from the Data Insights menu.
-
Select the Space Utilization dashboard.